- Supervised learning
- Unsupervised learning
- Reinforcement learning
Supervised learning
Basically used to make predictions about future data from labeled/categorized training dataset.
A dataset is a table where:
- each row is a sample
- each column is a feature
- each row is labeled with a class label
Classification
A supervised learning task with discrete class labels is called a classification task.
Classification is a subcategory of supervised learning where the goal is to predict the categorical class labels of new instances based on past observations.
Example:
Dataset with [data; label]
Data 0 : [ I like sport; Present]
Data 1 : [ I love shopping, Present]
Data 2 : [ I was in Amsterdam, Past]
Data 3 : [ I did something wrong, Past]
Data 4 : [ I do exercise every day, Present]
New data:
I did not know --> Past
I love running --> Present
With 2 possible class labels, the task is a binary classification task.
With more, it is a mutli-class classification task.
Example of multi-class dataset:
[Picture of cat; cat]
[Picture of dog; dog]
[Picture of mouse; mouse]
Here the machine learning system would be able to recognize a dog, a cat or a mouse but wouldn't succeed with any other animal because it is not part of our dataset.
Typical example of two-dimensionnal dataset for a binary classification task:
Data 0 : [ [0;0] ; Orange]
Data 1 : [ [1;1.5] ; Orange]
Data 2 : [ [1;2] ; Orange]
Data 3 : [ [1;2.8] ; Orange]
Data 4 : [ [2;1.5] ; Orange]
Data 5 : [ [2;2.5] ; Orange]
Data 6 : [ [3;0] ; Blue]
Data 7 : [ [3;1.5] ;Blue]
Data 8 : [ [3;2] ; Blue]
Data 9 : [ [4;2.8] ; Blue]
Data 10 : [ [4;1.5] ; Blue]
Data 11 : [ [4;2.5] ; Blue]
Data 12 : [ [5;3] ; Blue]
It is two-dimensionnal because each sample of the dataset has 2 values (usually named x1,x2). If we represent these samples on a 2-dimensionnal graph, we would see this:

The prediction would be based on the distribution of the sample. A point with x1 > 3 would be predicted as Blue and a point with x1 < 2 would potentially be red.
Regression
Regression is also called prediction of continuous outcomes. In regression analysis we give a serie of numbers (x or predictor) and response variables (y or outcome) and we try to find a relationship between them to predict a future outcome.
Ex:
with [x;y]
Data 0 : [ 0 ; 0 ]
Data 1 : [ 1 ; 1.5 ]
Data 2 : [ 1.5 ; 1 ]
Data 3 : [ 2 ; 2 ]
Data 4 : [ 2.5 ; 2.6 ]
Data 5 : [ 3 ; 3.2 ]
Data 5 : [ 4 ; 3.9 ]
Several types of algorithm can be selected to process input data. The following figure illustrates the concept of linear regression:

The computed curve will be used to predict the outcome of new data.
Reinforcement learning
Here the goal is to develop a system (agent) that improves its performances based on interactions with environment. The system will receive a feedback (reward) for every one of its actions. Each reward informs him of the quality of his action.
The agent will learn a series of actions that maximizes this reward via an empirical try-and-error approach.
A typical example is Google's Deepmind which beat the best Go players.
Unsupervised learning
In supervised learning, we include the right answer (labels) into the dataset. Here, we don't know the right answer beforehand. We are dealing with uncategorized data with an unknown structure.
With unsupervised learning, we can explore the structure of our data to extract meaningful information without an outcome or a reward.
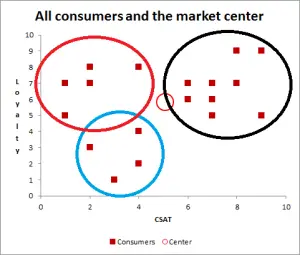
Clustering
Clustering is an exploratory data analysis technique which groups data together by similarity (unnsupervised classification).
Dimensionality reduction
Dimensionality reduction is another unsupervised learning field. To prevent against the computation of huge amounts of data which results in performance and storage issues, unsupervised dimensionality reduction preprocesses data to remove noise and retain relevant information.